CITY RHYTHM
How can I show the effects of online shopping on Rotterdam?
The rhythm of the city is constantly changing and moving. And especially now online shopping is slowly taking over and people are only going to city’s for the experience. How can I visualize the rhythm of the city by showing it in a different way.

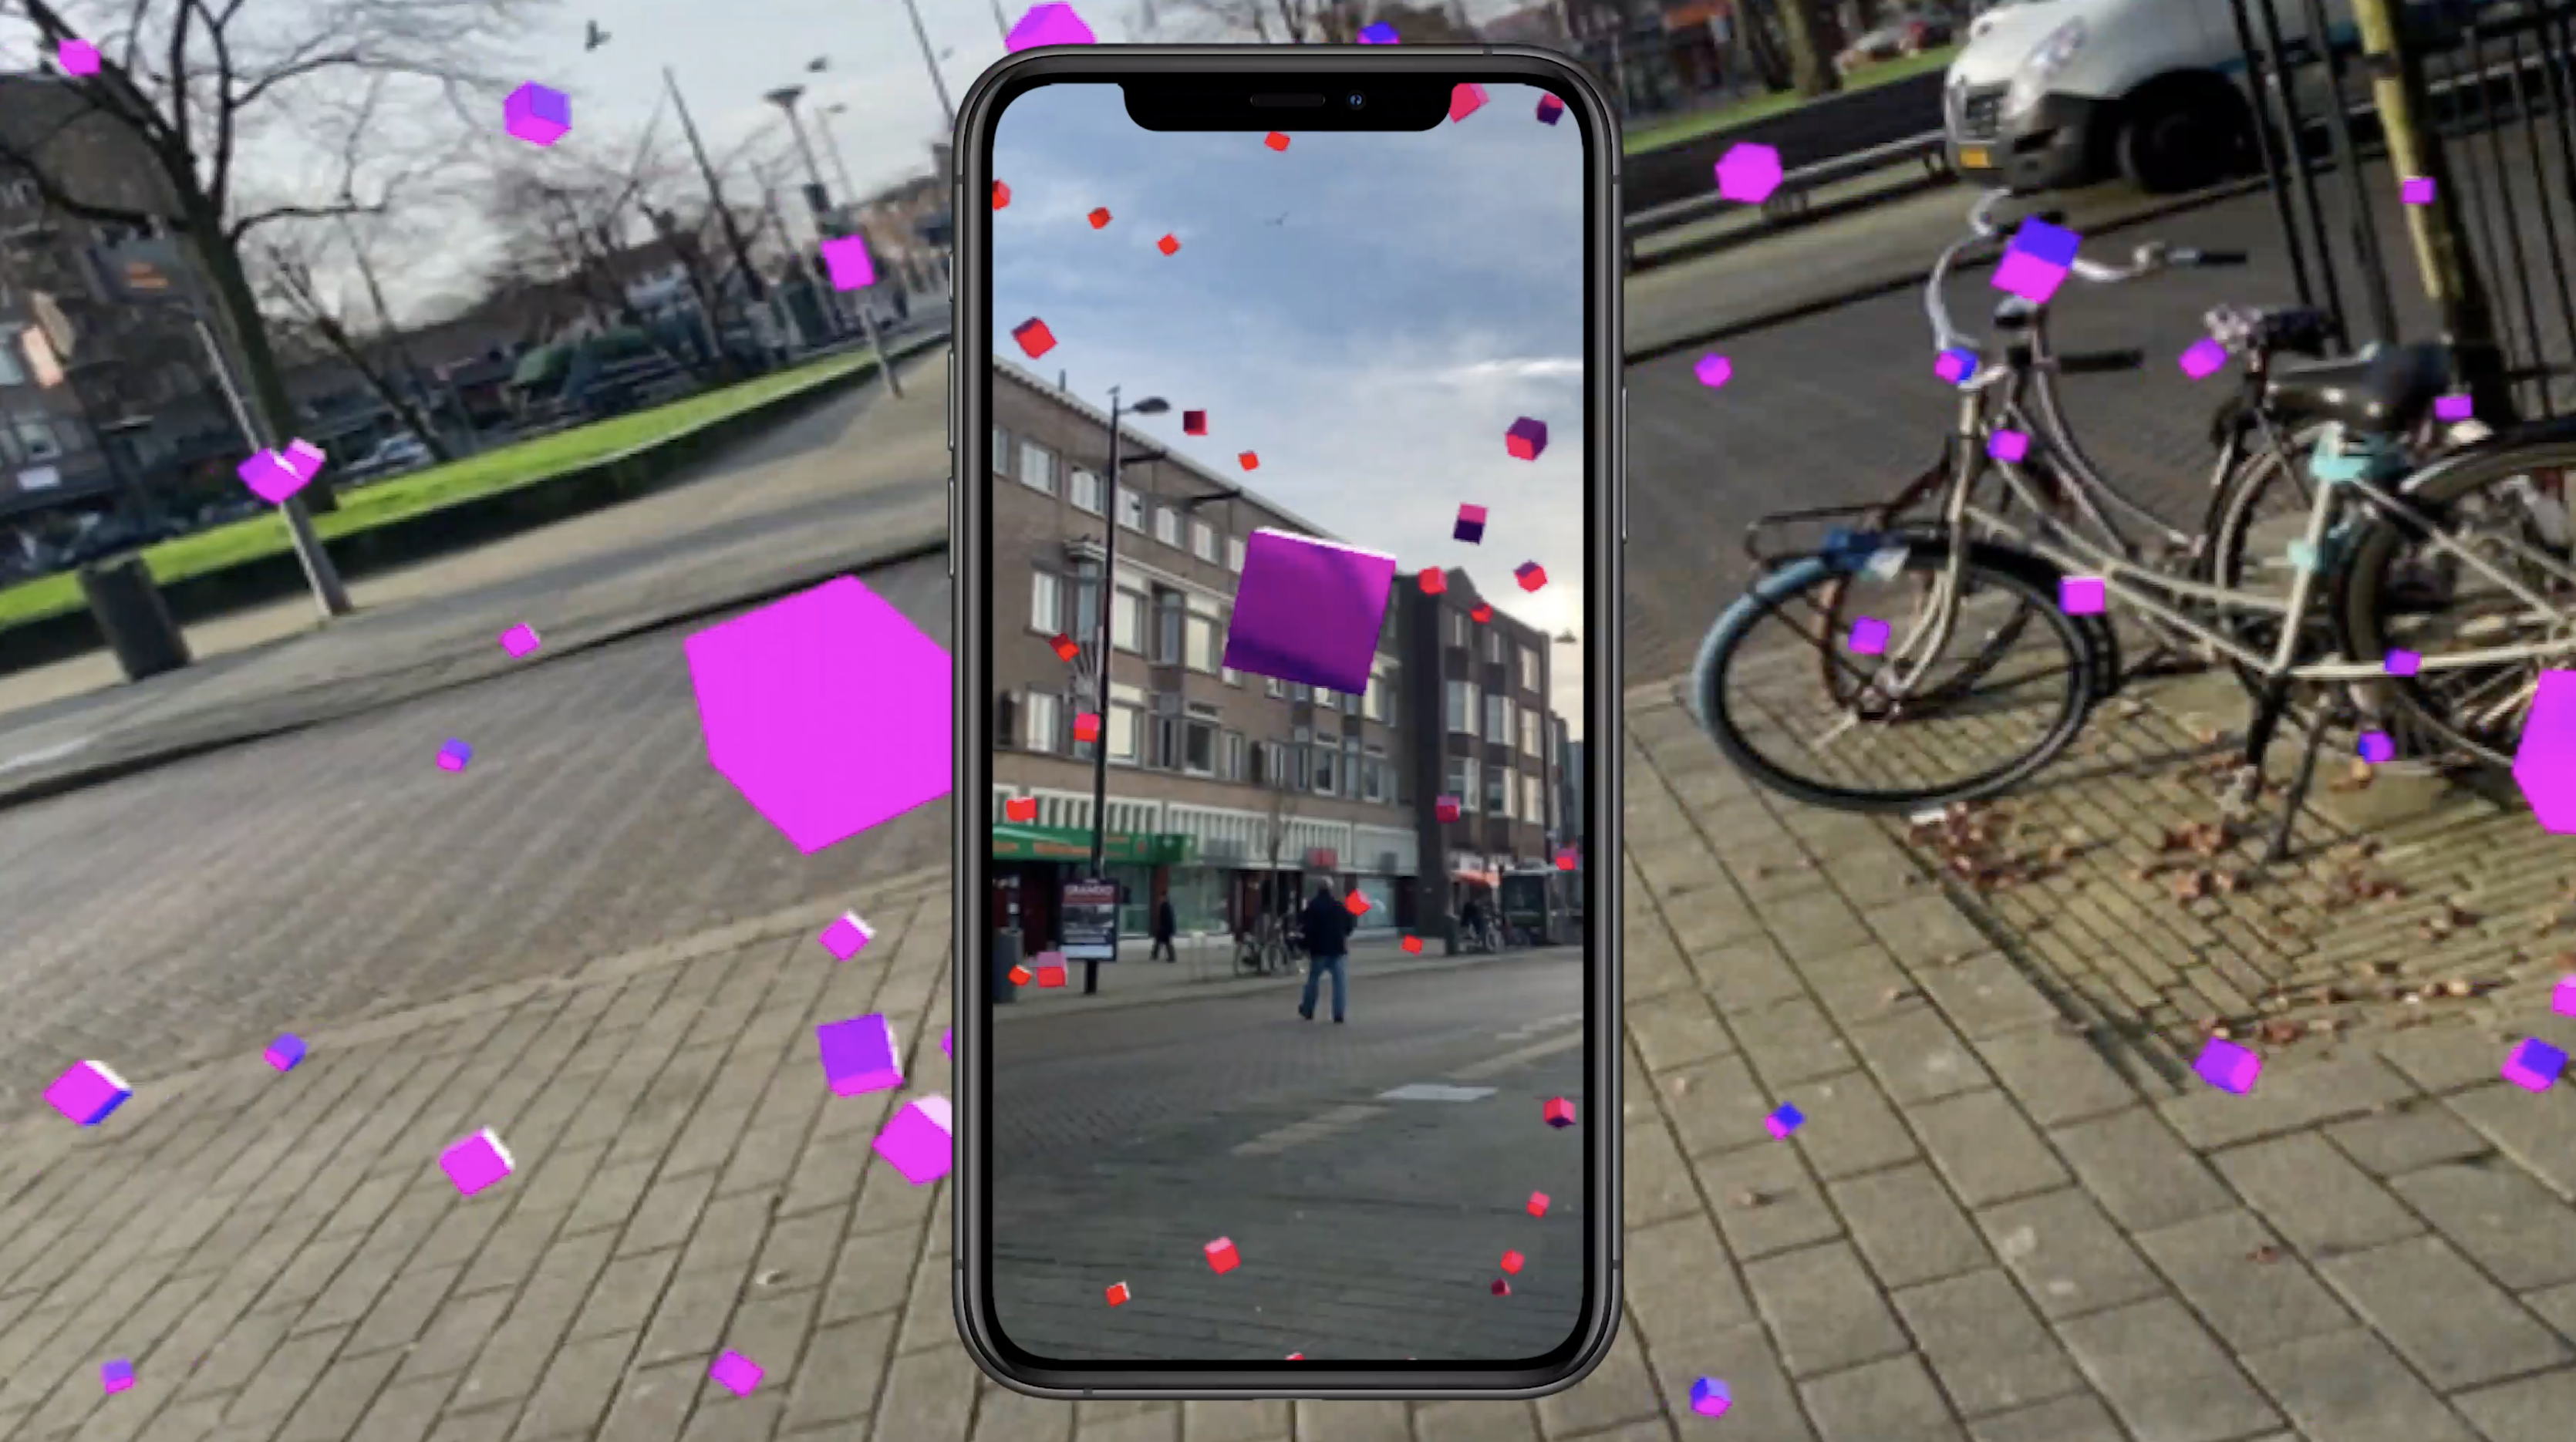
For this project I used realtime data from online shops or tweets that connect to the words ‘online shopping’. This way I project the realtime visuals of online shopping on the city centre of Rotterdam to make people aware of their online shopping behavior and its consequences on the rhythm of the city.
By using augmented reality I created a visual that represents the online shopping activity as floating boxes. This way you look through your phone how that activity is influencing the physical world. The boxes appear when somebody uses the words online shopping is used on twitter.
Not only did I make a visual you can see through your phone, I also made use of live security camera’s of the city centre. Using this live footage of streets where a lot of stores are, I created an overlay visual where you can see the ‘boxes’ fly around above the people. This way you see the difference between online activity and the city centre of Rotterdam.